
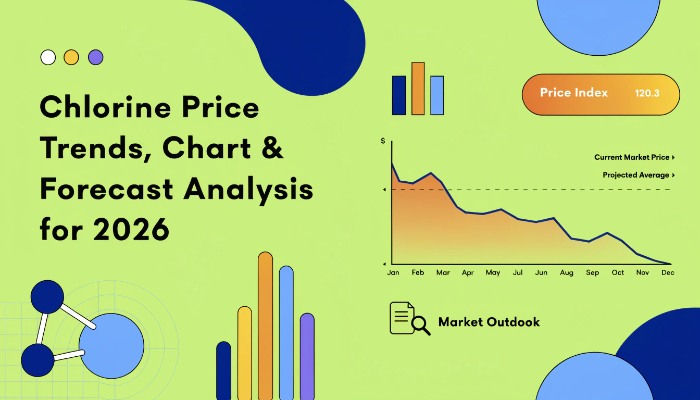
The global Chlorine Price movement in May 2026 reflected mixed regional trends, with noticeable declines in Asia and Europe, while North America recorded a strong increase. According to the latest Chlorine Price Chart, the overall direction leaned slightly downward due to weaker demand in key industrial sectors across Asia and Europe.
In Northeast Asia, prices stood at USD 0.37/kg, marking a -2.6% decline, while Europe saw a sharper drop to USD 0.43/kg, down by -23.2%. In contrast, North America recorded a significant rise, reaching USD 0.64/kg, reflecting a 14.3% increase. These variations highlight the regional imbalance in supply-demand conditions during the month.
Chlorine Price Chart Analysis
The Chlorine Price Chart for May 2026 shows a clear divergence in pricing patterns across regions, with a downward trend in Asia and Europe and a steady upward curve in North America.
At the beginning of May, prices in Asia and Europe were relatively stable, but as the month progressed, reduced industrial consumption—especially from the construction and PVC sectors—pushed prices lower. The lowest levels were recorded toward the end of the month, particularly in Europe where the decline was more pronounced.
On the other hand, North America displayed a consistent upward trajectory throughout May. The peak price was observed in the final week, supported by tight supply conditions and improved demand from water treatment and chemical processing industries.
When compared to Q4 2025, chlorine prices were more volatile during that period due to fluctuating energy costs. In contrast, May 2026 showed a more defined regional trend, making the price chart easier to interpret and analyze for procurement planning.
Chlorine Price Trend May 2026
The Chlorine price trend in May 2026 reflected a split pattern globally. While some regions experienced downward pressure, others showed resilience and growth.
In Asia and Europe, the trend remained soft due to:
- Lower operating rates in downstream industries
- Sufficient inventory levels
- Reduced export activity
Meanwhile, North America witnessed a positive trend driven by:
- Improved demand from municipal water treatment
- Stable industrial output
- Controlled supply availability
Overall, the global direction remained balanced, with no extreme fluctuations, but clear regional contrasts shaping pricing behavior.
Regional Price Analysis
North America
North America recorded the highest price level at USD 0.64/kg, with a notable upward movement of 14.3%. This increase was supported by steady demand from infrastructure-related sectors and water treatment facilities. Supply remained relatively tight, contributing to the upward price movement.
Europe
Europe experienced the sharpest decline among all regions, with prices falling to USD 0.43/kg, reflecting a -23.2% drop. Weak demand from construction-related applications and sufficient product availability led to this downward pressure. Energy cost stabilization also played a role in easing price levels.
Asia-Pacific
In Northeast Asia, chlorine prices settled at USD 0.37/kg, showing a -2.6% decrease. The region witnessed moderate demand, but ample supply and reduced industrial activity kept prices under pressure. Export competitiveness remained limited due to global pricing differences.
Regional Price Snapshot – May 2026
- Northeast Asia: USD 0.37/kg (↓ -2.6% Down)
- Europe: USD 0.43/kg (↓ -23.2% Down)
- North America: USD 0.64/kg (↑ 14.3% Up)
This snapshot highlights a clear regional divide in pricing. Asia and Europe faced downward pressure due to weaker consumption and stable supply, while North America saw strong upward momentum driven by demand and tighter availability. The variation reflects how regional industrial activity directly influences chlorine pricing trends.
Key Market Drivers
- Demand fluctuations in PVC and construction-related industries
- Supply availability and production rates across regions
- Energy costs impacting production economics
- Seasonal demand from water treatment applications
- Inventory levels in major consuming regions
- Trade flow and export-import dynamics
Chlorine Price Forecast 2026
The Chlorine price forecast 2026 suggests a moderately stable outlook with region-specific variations likely to continue.
Prices in North America may remain firm if demand from infrastructure and water treatment sectors continues. In contrast, Asia and Europe could experience gradual recovery if industrial activity improves in the second half of the year.
Overall, the forecast indicates:
- Stable to slightly improving prices in Asia and Europe
- Continued strength in North America
- Limited volatility due to balanced supply-demand conditions
Unexpected changes in energy costs or industrial demand could still influence short-term price direction.
Chlorine Price Index & Historical Comparison
The Chlorine Price Index provides a useful benchmark for tracking price movements over time. In May 2026, the index reflected a mixed pattern, with declines in Asia and Europe offset by gains in North America.
Looking at the chlorine price history chart, prices in late 2025 were influenced heavily by energy cost fluctuations and supply disruptions. Compared to that period, May 2026 shows more stability, despite regional differences.
The index indicates that current prices are relatively moderate compared to previous peaks, suggesting a more balanced pricing environment overall.
Impact on Related Markets
Chlorine pricing plays a significant role in several downstream industries:
- PVC production: A key raw material, impacting construction and infrastructure sectors
- Water treatment chemicals: Influences municipal and industrial treatment costs
- Chemical manufacturing: Affects production costs for various intermediates
- Textile and paper industries: Impacts bleaching and processing costs
Changes in chlorine prices can directly affect cost structures across these sectors, influencing broader industrial activity.
FAQs About Chlorine Price Trends & Market Insights:
What Does The Chlorine Price Chart Indicate In May 2026?
The Chlorine Price Chart shows a downward trend in Asia and Europe, while North America experienced an upward movement due to stronger demand and tighter supply.
How Is The Chlorine Price Index Determined?
The Chlorine Price Index is calculated using regional price averages, supply-demand conditions, and trade data, helping track overall price direction over time.
What Is The Chlorine Price Forecast 2026?
The chlorine price forecast 2026 indicates stable to slightly improving prices globally, with North America expected to remain strong and other regions showing gradual recovery.
Request a sample for real-time Chlorine price insights and forecast data:
https://www.imarcgroup.com/chlorine-pricing-report/requestsample
Conclusion: Final Insights and Outlook
May 2026 presented a mixed scenario for chlorine pricing, with clear regional differences shaping the overall trend. While Asia and Europe experienced declines, North America showed strong upward momentum.
The overall outlook remains stable, with balanced supply and demand expected to support prices in the coming months. For buyers and industry participants, this environment offers better predictability and opportunities for strategic planning.
Contact Us:
IMARC Group
134 N 4th St. Brooklyn, NY 11249, USA
Email: sales[@]imarcgroup.com
Tel No:(D) +91 120 433 0800
United States: +1-201971-6302

 Arabic
 French
 Spanish
 Portuguese
 Deutsch
 Turkish
 Dutch
Dutch
 Italiano
 Russian
 Romaian
 Portuguese (Brazil)
 Greek
Greek